
A Click Measuring Contest
As the saying goes: Likes don't pay the bills...sales do. So much of what we do as an agency can, and should, be measured. Creatives, consultants, and influencers have to be transparent about a realistic return on investment. Interaction is not a transaction. Below: six examples of how we're calibrating campaigns with our clients, and using that data to inform strategy, design, and message.
1. Event-Specific Measurements
Single day sales, fundraising deadlines, gala events—these all offer clear windows for quantifying marketing's impact on sales. Key performance indicators (KPIs) will obviously vary from cash register results to donations or attendance numbers, but it's a clear look at whether (or not) the campaign creative was compelling. Here, examples and results from Giving Tuesday (2019) for Double H Ranch, who crushed their fundraising goal.

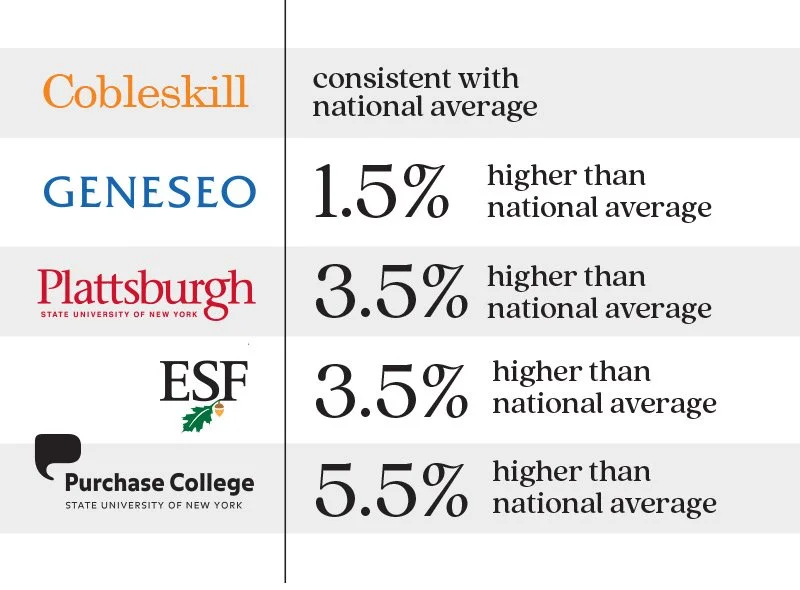
2. Tracking Against Trends
The US Department of Education reports that college enrollment has dropped 3.5% nationwide. In addition, New York State has seen a drop in population and the unemployment rate is at a record low 3.9%. This has affected enrollment numbers at campuses across the empire state. While outside factors like those can seem like justification for lower sales, there are some things that can't be solved with a killer headline. We want SUNY schools to be flush with freshmen, but a drop in New Yorkers and ample employment opportunities are difficult market conditions to overcome. Stagnant enrollment (never the goal) can still be considered a victory when compared to colleges across the country.

3. Return On Ad Spend
Probably the truest way to measure the efficacy of a given ad campaign. ROAS contrasts marketing budget and sales to provide a return-on-investment figure. Divide revenue generated by marketing budget to arrive at your ROAS. A good result is a 4:1 ratio, meaning for every dollar spent on advertising, you're making $4. In what can only be considered a spectacular humblebrag, the above chart shows ROAS of $40 as the result of a Trampoline advertising campaign from the 4th quarter of 2019. That's $39.ºº of profit for every buck the client spent with us.


4. A/B Testing
Different strokes for different folks! Swap headlines, exchange photos, target different demos. Build-to-suit, and tweak the design until it is the most effective version (with the best results).If it sounds a little like trial and error, well, it is. But in the digital realm, 'error' has a shelf life as short as the refresh button. We look at campaign creative as an ongoing effort. Yep, we still get approvals before submitting ads, but we're seeing the design process continue well beyond upload.Try testing an assertive concept against a more conservative approach, then see which one does better. Push the advertising envelope.

5. Location Pinpointing
Where are we? Who is seeing our stuff? Should we change the creative based on where the most interaction is taking place? Location matters, especially with digital and social—but also considering repeat impressions and strategies like geofencing, it really helps to know where you're interacting with consumers. Two separate examples—above: location results for an Oneonta, NY tourism campaign and below: open-rates by state for a SUNY recruitment campaign.

6. Just count, like, anything honestly.
Below, a shot of the Wildcat Mountain parking lot on the first Saturday of 2020. It was a 2,000 guest day, and the slopes were full of happy skiers. The Born Wild™ ad campaign has consistently communicated that Wildcat is a mountain not to be missed—a skiers' paradise with no frills and all thrills. We've positioned the mountain as a guaranteed good time and fed the FOMO beast for skiers from Boston to Quebec. The results are in: a bigger parking lot may be necessary.

